- The January–September global surface temperature averaged about 1.47°C above the 1850–1900 baseline.
- The satellite sea-level record dates to 1993.
- The 2026 ocean heat assessment was still preliminary in November.
Inside this story 2 perspectives
The most revealing words on the World Meteorological Organization’s climate update are easy to skip on the way to the temperature figure. They are the dates underneath each measurement. For global surface temperature the report could look through September. For ocean heat its preliminary assessment reached July. The state of the planet on one November morning arrives on several different timetables.
The WMO released its update on 9 November as the UN climate conference opened in Antalya, Türkiye. For January to September, the global mean surface temperature was about 1.47°C above the average for 1850 to 1900. Sea level reached the highest point in the satellite record, which begins in 1993. The preliminary ocean data put 2026 on course for a tenth successive year of record ocean heat content. That last statement is expressly a provisional reading of part of the year.
What each instrument can see
Surface temperature, sea level and ocean heat describe different physical quantities. A measurement of the sea surface does not, on its own, reveal how much heat is stored deeper in the ocean. Similarly, a satellite record of changing sea level gives a broad view that a single gauge at one harbour cannot reproduce. A global update combines observations that answer different questions and become available at different speeds.
The reference periods differ too. A temperature anomaly is the distance from a specified temperature average. A ranking in the satellite sea-level record compares an observation with other values in that particular series. Neither number tells a person in a given coastal town how high water will be at the front door during the next storm. A local forecast has to account for local conditions, and a local warning has its own time and place.
The year still has two months to run
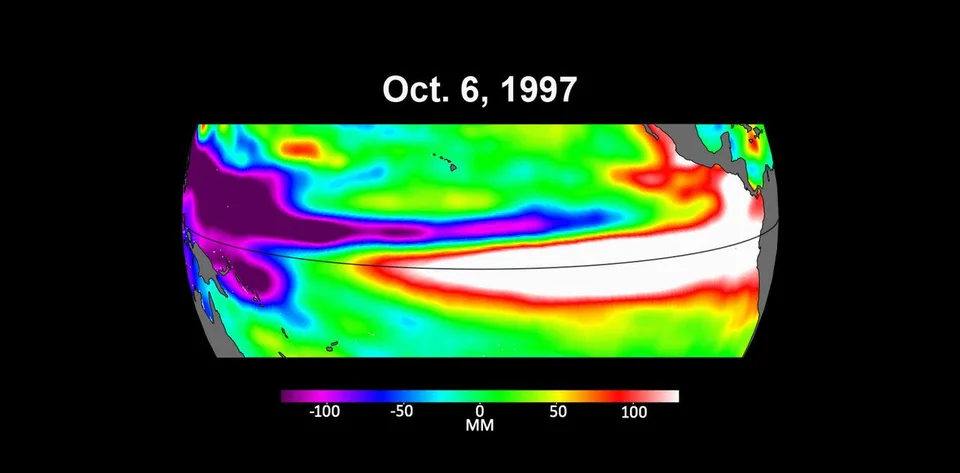
November also matters for a phenomenon that has been developing in the Pacific. The WMO says El Niño intensified from August. A January-to-September average consequently includes many months before that intensification. A reader interested in the latest effects needs forecasts and newer observations alongside the published global average. Adding the word provisional in small type cannot do all of that explanatory work.
The next time a climate number appears on a chart, try reading its caption as a sentence. What did somebody measure, over what area, and between which dates? That exercise leaves the scale of the WMO’s findings intact. It also makes the achievement clearer. Researchers and observing services around the world have measured enough different pieces of one changing system to tell readers both what they can see in November and where the record still has to catch up.