- The combined weekly Sensitive Price Indicator rose 0.21% in the week to 1 October.
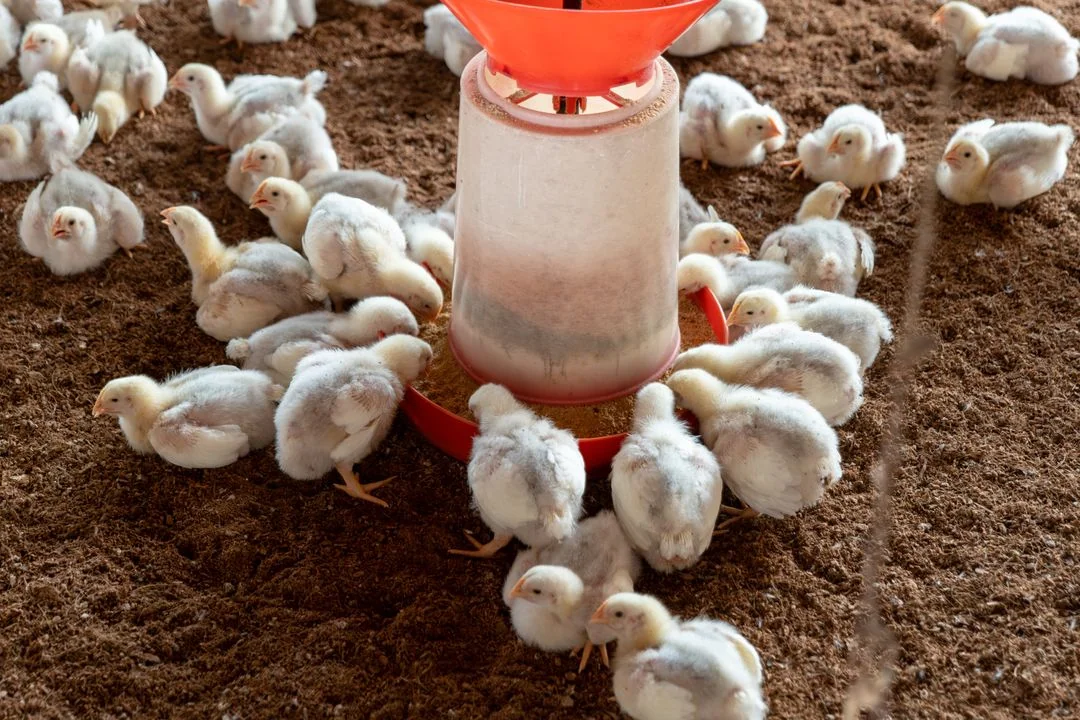
- Chicken was 7.25% dearer than a week earlier. Diesel fell 3.43%.
- The survey tracks 51 essential items in 17 urban centres and reports separate expenditure groups.
Inside this story 2 perspectives
A household buying chicken in Pakistan in the week ending 1 October encountered a price increase that would look out of place in the main headline. Chicken rose 7.25 per cent from the previous week. The combined Sensitive Price Indicator, the Pakistan Bureau of Statistics reported on Friday, 2 October, rose just 0.21 per cent. Both numbers come from the same report and measure the same week. They describe different purchases.
The bureau follows 51 essential items in 17 urban centres. For this release, twenty items went up in price, ten became cheaper and twenty-one were unchanged. The count alone cannot produce the headline number. Each change has a size, and each item has a weight in the spending patterns used to compile the indicator. A household buying ingredients for a particular meal can concentrate its spending on one of the largest risers without buying any of the things that got cheaper.
Compare the same week first
Alongside chicken, garlic rose 1.85 per cent and gram pulse rose 1.30 per cent. Sugar fell 1.05 per cent and potatoes cost 0.96 per cent less on average than a week earlier. Diesel prices dropped 3.43 per cent. A driver and someone shopping on foot both appear in the economy described by the national figure. Only one may have bought diesel that week, and the amount saved at the pump will depend on the amount bought.
The bureau calculates weekly results for five expenditure groups as well as the combined figure. Their increases ranged from 0.19 to 0.22 per cent this time. Similar movements over a short period can conceal much greater differences over a year. The corresponding annual increases across the five groups ranged from 9.00 to 11.99 per cent. The report puts the combined annual change at 11.53 per cent.
The onion tells a longer story
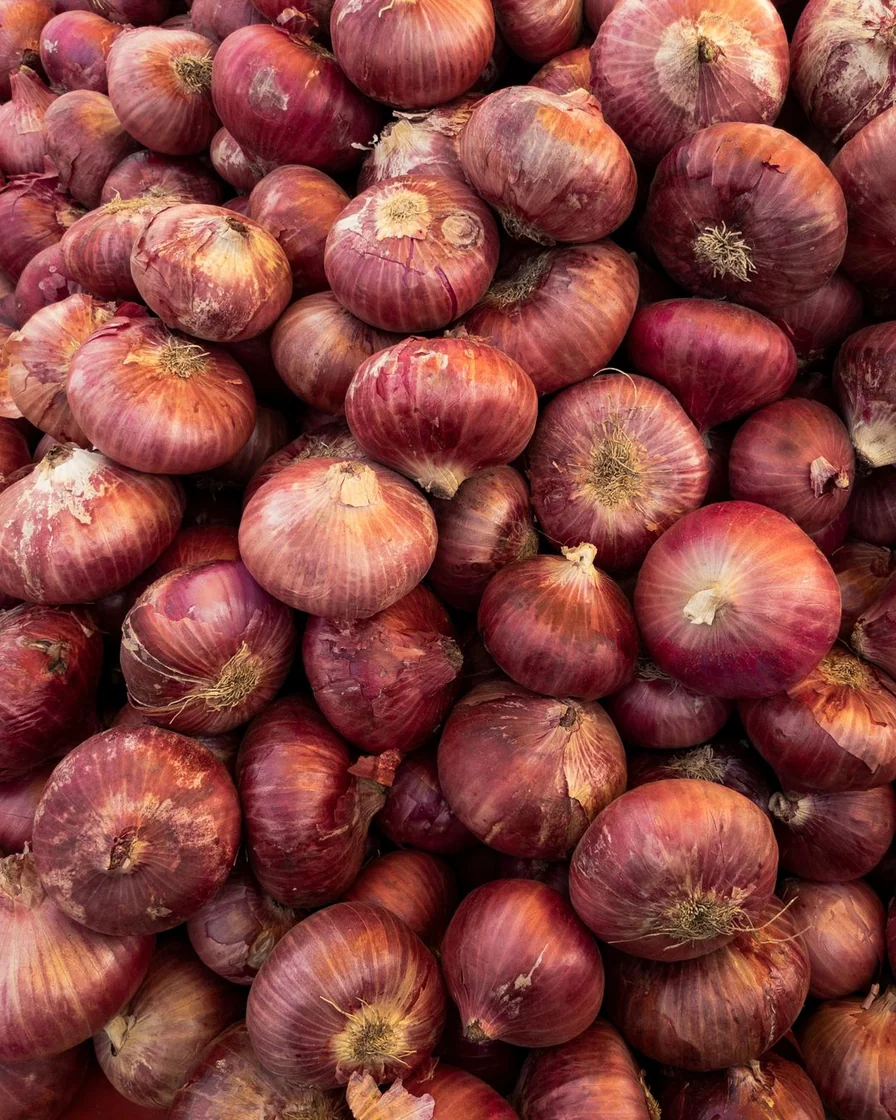
Onions offer an especially clear illustration of the calendar problem. Their measured price rose 0.39 per cent over a week and 114.20 per cent over a year. The annual comparison means they cost more than twice what they did in the corresponding week of 2025. It gives no reason to expect another doubling in the coming weeks. The modest weekly movement does little to erase the earlier change in a shopper's budget.
For anyone trying to understand why a regular shop now costs more, a list of quantities as well as prices is worth keeping. Buying less of an expensive item may hold the bill steady even when its price has climbed steeply. The weekly indicator supplies the broader setting. The quantities on a household's own list explain how that setting turns into the amount actually paid.